
Johannesburg – JSE-listed Aspen Pharmacare Holdings Limited (APN), a global multinational specialty pharmaceutical company, has reported unaudited Group interim financial results for the six months ended 31 December 2025.
Stephen Saad, Aspen Group Chief Executive said, “The first half of FY2026 demonstrates steady execution of our strategy, underpinned by strong Commercial Pharmaceuticals performance and decisive action to optimise our Manufacturing platform. The period reflects transitional impacts aligned with guidance. The Aspen APAC divestment has unlocked value and will enhance financial flexibility. We are confident in the Group’s ability to deliver sustainable earnings growth and deliver on its strategic objectives, driving value and returns for shareholders.”
COMMENTARY
During the six months ended 31 December 2025 (“H1 2026”) the Group focused on the execution of its strategic priorities as communicated to stakeholders in a SENS announcement published on 29 December 2025 and during the stakeholder engagement call held on 15 January 2026. The Group delivered an encouraging performance for H1 2026 supported by the continued strong momentum in Commercial Pharmaceuticals and solid progress in reshaping its sterile FDF Manufacturing facilities in South Africa and France. One-off restructure costs of R695 million relating to these sterile FDF Manufacturing facilities have been incurred in H1 2026 and have negatively impacted earnings per share (“EPS”) and headline earnings per share (“HEPS”). H1 2026 should be viewed as transitional with stronger relative performance anticipated in the second half of FY 2026, as the benefits of operational improvements and the reshaping within Manufacturing are progressively realised.
The comparative performance for the period has been influenced by a high base in the prior year. FY 2025 operating performance was heavily weighted towards the first half (“H1 2025”), which included a contribution from the subsequently cancelled mRNA Manufacturing contract (of circa R1,5 billion), resulting in normalised Group EBITDA of R5,8 billion in H1 2025. The second half of FY 2025 (“H2 2025”) reported normalised Group EBITDA of R3,8 billion, reflecting a reversal of a portion of this contribution (of circa R0,5 billion) following the emergence of a material contractual dispute in respect of the mRNA Manufacturing contract (“the Dispute”). The Dispute was settled in October 2025, with the counterparty paying Aspen EUR25 million (circa. R0,5 billion) (“Settlement Proceeds”). While Manufacturing EBITDA for the period benefited from the Settlement Proceeds, the absence of the prior-period mRNA contribution has resulted in H1 2026 normalised EBITDA of R5 053 million being lower than H1 2025 by 13% (-12% CER). This outcome is consistent with guidance to the market.
H1 2026 performance highlights include:
- Commercial Pharmaceuticals, Aspen’s most material business segment, delivered revenue growth of 4% and normalised EBITDA growth of 11% in constant exchange rates (“CER”) underpinned by organic revenue growth across all three segments (Injectables, OTC and Prescription). Performance was supported by strong demand for Mounjaro® in South Africa and an improved profit contribution from the reshaped business in China. Reported performance was diluted by the strength of the ZAR against most of Aspen’s major trading currencies during the period;
- Manufacturing achieved a positive EBITDA in H1 2026 of R208 million, aided by the receipt of the Settlement Proceeds. The reshaping of the loss-making sterile FDF Manufacturing facilities in South Africa and France is well progressed with the expected benefit of the cost reductions to positively impact from H2 2026 onwards and planned to be fully realised in FY2027;
- Commercial production of insulin in our South African sterile FDF Manufacturing facility is well advanced with final regulatory approval expected in the first quarter of calendar year 2026;
- Free cash flow (excluding dividends paid) ended at R1 997 million supported by an operating cash conversion rate of 193%, a working capital to revenue ratio of 45% and lower capital expenditure relative to the comparative period;
- The stronger free cash flow, together with favourable ZAR closing rates, led to lower net debt of R28,6 billion (compared to June 2025 of R31,2 billion) and a leverage ratio (net debt to EBITDA) of 3.4x; and
- The divestment of Aspen APAC (“APAC Divestment”) for a gross consideration of AUD 2 370 million was announced on 29 December 2025 and subsequently discussed during a stakeholder engagement call on 15 January 2026. The transaction remains subject to certain conditions precedent, including the requirement of general shareholder approval. The expected completion date is the end of May 2026. The APAC Divestment meets the requirements of IFRS 5 – Non-current Assets Held-for-Sale and accordingly the net asset value of Aspen APAC, being R21,8 billion, has been classified as “net assets held-for-sale” and the performance results for the period, including comparatives, have been separately disclosed under discontinued operations.
GROUP PERFORMANCE
The key performance indicators for the Group for total operations, which includes continuing operations and discontinued operations, are set out below. All performance-based commentary relates to total operations unless stated otherwise.
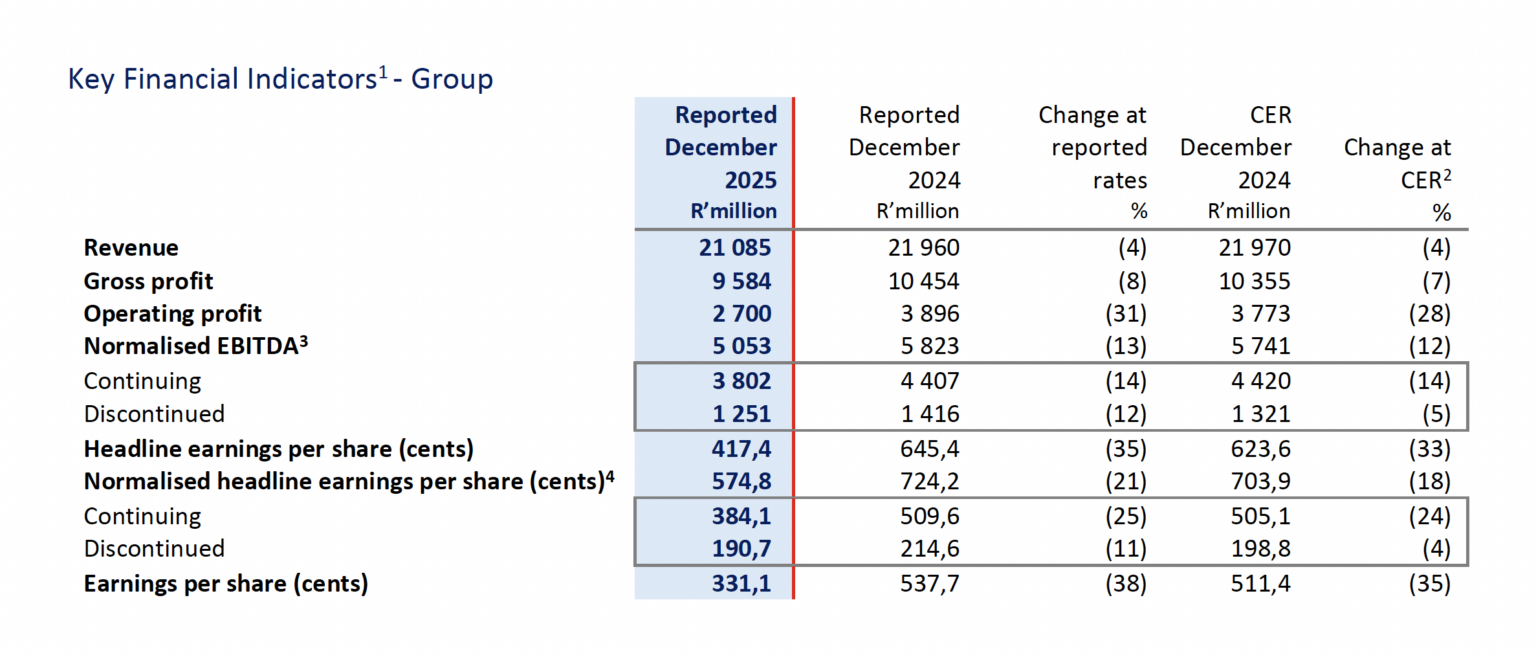
1 The Group assesses its operational performance using constant exchange rates (“CER”). The table above compares performance to the prior comparable period at reported exchange rates and at CER.
2 The CER percentage change is based upon the performance for the six months ended 31 December 2024 recalculated using the average exchange rates for the six months ended 31 December 2025.
3 Operating profit before depreciation and amortisation adjusted for specific non-trading items as defined in the Group’s accounting policy.
4 Normalised headline earnings per share (“NHEPS”) is headline earnings per share (“HEPS”) adjusted for specific non-trading items as defined in the Group’s accounting policy.
SEGMENTAL PERFORMANCE
The key performance indicators for the Group’s two business segments, being Commercial Pharmaceuticals and Manufacturing, are set out below. All performance-based commentary relates to total operations, unless stated otherwise.
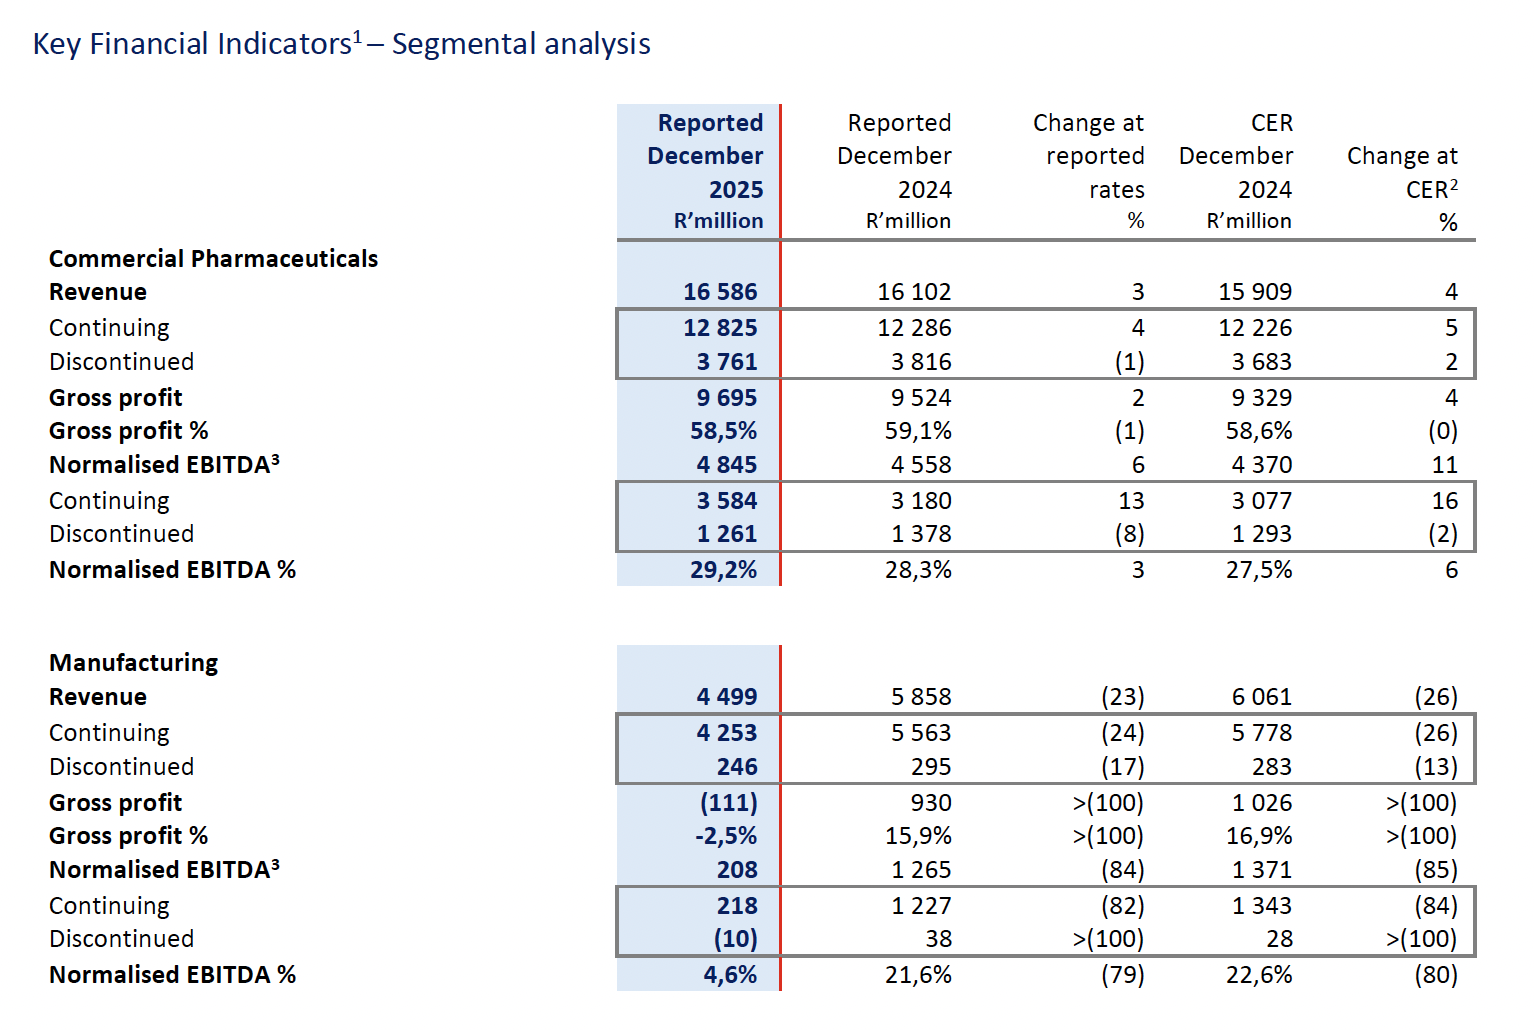
1 The Group assesses its operational performance using constant exchange rates (“CER”). The table above compares performance to the prior comparable period at reported exchange rates and at CER.
2 The CER percentage change is based upon the performance for the six months ended 31 December 2024 recalculated using the average exchange rates for the six months ended 31 December 2025.
3 Operating profit before depreciation and amortisation adjusted for specific non-trading items as defined in the Group’s accounting policy.
Commercial Pharmaceuticals (Total Operations)
Commercial Pharmaceuticals reported revenue growth of 3% (4% CER) to R16 586 million and higher normalised EBITDA growth of 6% (11% CER) augmented by the reshaped business in China. The gross profit margin of 58,5% was impacted by the relative strength of the ZAR against most of Aspen’s major trading currencies during the period. Aspen APAC was adversely impacted by the weakening of its basket of currencies, particularly the Australian Dollar, with normalised EBITDA declining by 8% (-2% CER). Normalised EBITDA for Continuing Operations increased by 13% (16% CER) to R3 584 million on a revenue growth of 4% (5% CER).
Manufacturing (Total Operations)
Manufacturing revenue of R4 499 million ended 23% lower (-26% CER) and normalised EBITDA of R208 million declined by 84% (-85% CER) primarily due to the absence of the prior period mRNA contribution.
PROSPECTS
Aspen remains focused on executing its communicated strategic priorities which will drive sustainable future growth and performance in Commercial Pharmaceuticals and Manufacturing. In anticipation of the successful completion of the APAC Divestment, guidance (which has remained consistent over the period) has been updated to reflect the expected performance of Continuing Operations (excluding the APAC business) as set out below:
For financial year 2026, Commercial Pharmaceuticals is expected to deliver mid-single digit organic CER revenue growth and double-digit normalised CER EBITDA growth, supported by a higher EBITDA margin %. Manufacturing normalised EBITDA is expected to be broadly in line with the prior financial year in CER, with the loss of the mRNA contribution of circa R1 billion being offset by operational improvements arising from the reshaped sterile FDF Manufacturing facilities in France and South Africa. The sterile FDF Manufacturing facilities are targeted to shift to positive normalised EBITDA and cash flow by financial year 2027.
Group normalised CER EBITDA for this year is targeted to achieve at least double the first half EBITDA of R3,8 billion, supported by strong second half growth relative to the H2 2025 CER EBITDA of R2,4 billion. Consequently, the Group anticipates double-digit CER growth in normalised headline earnings in financial year 2026.
Aspen expects to generate stronger free cash flow in the current financial year, underpinned by an operating cash conversion rate which is forecast to exceed 100% and lower working capital and capital expenditure compared to previous financial year. Proceeds from the APAC Divestment will effectively eliminate most of the Group’s net debt setting the foundation for improved balance sheet flexibility, supporting future capital allocation, enhancing the Group’s ability to deliver on its strategic objectives and driving value and returns for shareholders.
Any forecast information in the above-mentioned paragraphs has not been reviewed or reported on by the Group’s auditors and is the responsibility of the directors.